Your margin dropped from 35% to 10%. Is your operation built for it?
Support at Home eliminated package management fees and halved care management. NDIS price caps haven't moved. The providers who survive won't grow fastest; they'll leak the least. ShiftCare gives you the operational visibility to hold your margin, shift by shift.
NDIS price caps haven't moved, but SCHADS wages keep climbing. Penalty rates expand, compliance loads grow, and the rate card rarely keeps pace. You can't negotiate your way out. The only lever left is reducing operational leakage: overtime patterns, casual dependency, and the gap between hours paid and hours billed.
| Leakage Category | Annual Cost | The Reality |
|---|---|---|
| Structural Overtime | $132k | 150 OT hours/week at SCHADS penalty rates your bundled price doesn't recover |
| Shift Overrun | $103k | 1 in 9 shifts runs 24 minutes over. Drift, not malice, but you pay for every minute |
| Casual Dependency | $89k | 25% SCHADS loading on every excess casual hour. Above 40% = structural compression |
| Late Clock-Outs | $76k | Full-time staff are the worst offenders at 63% of late exits |
| Cancellation Drag | $65k+ | 2 cancellations/day = 1,560 lost hours/year. Can't redeploy in 15 min? Revenue gone |
| Rostering Without Cost Ownership | $45k | Rosters built for coverage, not margin. No local P&L accountability |
| Total Annual Leakage | $510k | 150-client provider at 10% margin |
$510,000. That's what the average 150-client provider leaks every year.
Not from poor care. Not from bad intent. From thousands of micro-decisions made every shift that no one is measuring. At 10% margin, recovering $510k requires $5.1M in flawless new service revenue. Or you could fix the leakage instead.
It's not a growth problem
Most providers chase revenue to cover operational losses they can't see. The leakage happens before a single new client walks through the door.
It's a discipline problem
Overtime patterns, casual dependency, billing gaps: these aren't random. They're structural. And they're measurable if you have the right system.

"We were funding care hours without realising it. Once we could see our paid vs billed ratio weekly, we recovered over $80,000 in the first quarter."
Operations Manager
150+ Staff NDIS Provider, NSW
The margin buffer that protected operational inefficiency no longer exists.
Under HCP, you could recover up to 35% outside service delivery: 20% care management, 15% package management. Support at Home collapsed this to 10%. Package management fees are gone. Extra fees are gone. Price caps apply from July 2026.
Margin now lives in operations
Scheduling efficiency, workforce utilisation, travel optimisation, and billing accuracy. Every one of those is operational, not financial.
Transaction-based billing changes everything
Under SAH, you claim from Services Australia first. They confirm the participant contribution. Only then can you invoice. No claim = no billing = no cash.
Run your numbers.
Six inputs. Two minutes. See exactly where your margin is leaking.
At 10% margin, you'd need $0 in flawless new revenue to recover this.
If you can't see these on Monday morning, you already lost margin last week.
Leading providers answer all five before their first coffee. Most can't answer three. Which camp are you in?
Overtime %
Above 8% is structural, not temporary. ~$132k/year for a 150-client provider.
Casual %
Above 40% means the 25% SCHADS loading is eating your margin every single week.
Paid vs Billed
Every point below this threshold is unrecovered time you're personally funding.
Cancellation Recovery
If you can't redeploy within 15 minutes, the revenue is gone. Speed is the only lever.
Leave Exposure
Above this, you're storing future overtime. When leave is taken, you backfill at penalty rates.

Scheduling to reporting. No spreadsheet bridges.
Under SAH, every disconnected step is a margin leak. You claim from Services Australia first. They validate. Confirm the participant contribution. Only then can you invoice. ShiftCare connects all six steps in one system so nothing falls through the gaps.
Award rules fire before roster confirmation
SCHADS alerts catch overtime, penalty rate triggers, and casual loading before you approve the shift, not after payroll runs.
Claims generated from delivered services
Visit verification, timesheets, and billing codes flow automatically. No manual re-entry. No billing lag. No rejected claims from wrong codes.
"ShiftCare showed us our casual ratio was 47%. We restructured our workforce mix and saved $62,000 in the first six months."
CEO
200+ Staff Aged Care Provider, VIC
Visibility. Verification. Ownership.
Operational discipline becomes structural when three things exist. Leaders can see the signals. Rules are enforced inside the workflow. And someone is accountable for margin at the branch level, reviewing it every week.
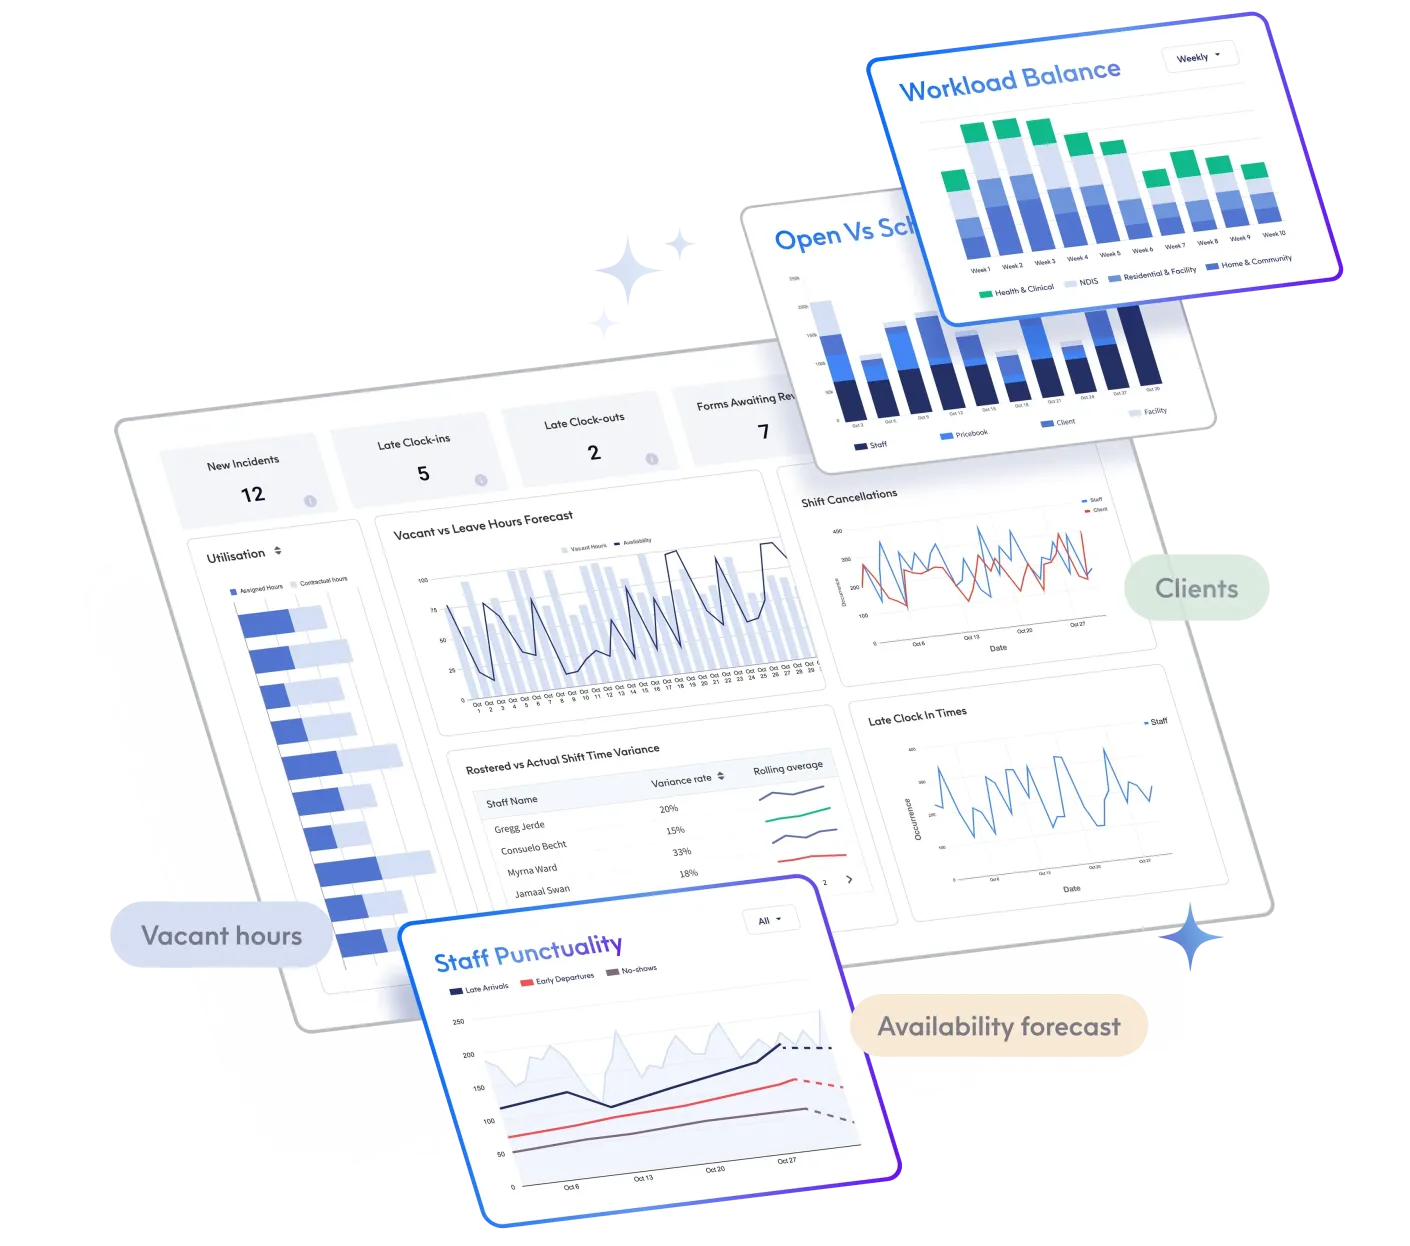
Weekly operational dashboards
Overtime trends by branch, late shift variance, paid vs billed gaps, and cancellation recovery: visible weekly, not buried in monthly reports.
Compliance inside the workflow
GPS clock-in/out, shift boundary rules, activity logs, and award rule detection. Verification replaces policy. Problems are caught before they hit payroll.
How ShiftCare closes each leakage category.
Visibility.
- Real-time overtime trends by branch
- Late shift variance tracking
- Paid vs billed hour gaps surfaced weekly
- Cancellation redeployment performance
Verification.
- Award rule detection before roster confirmation
- Activity logs for sleepovers and overnights
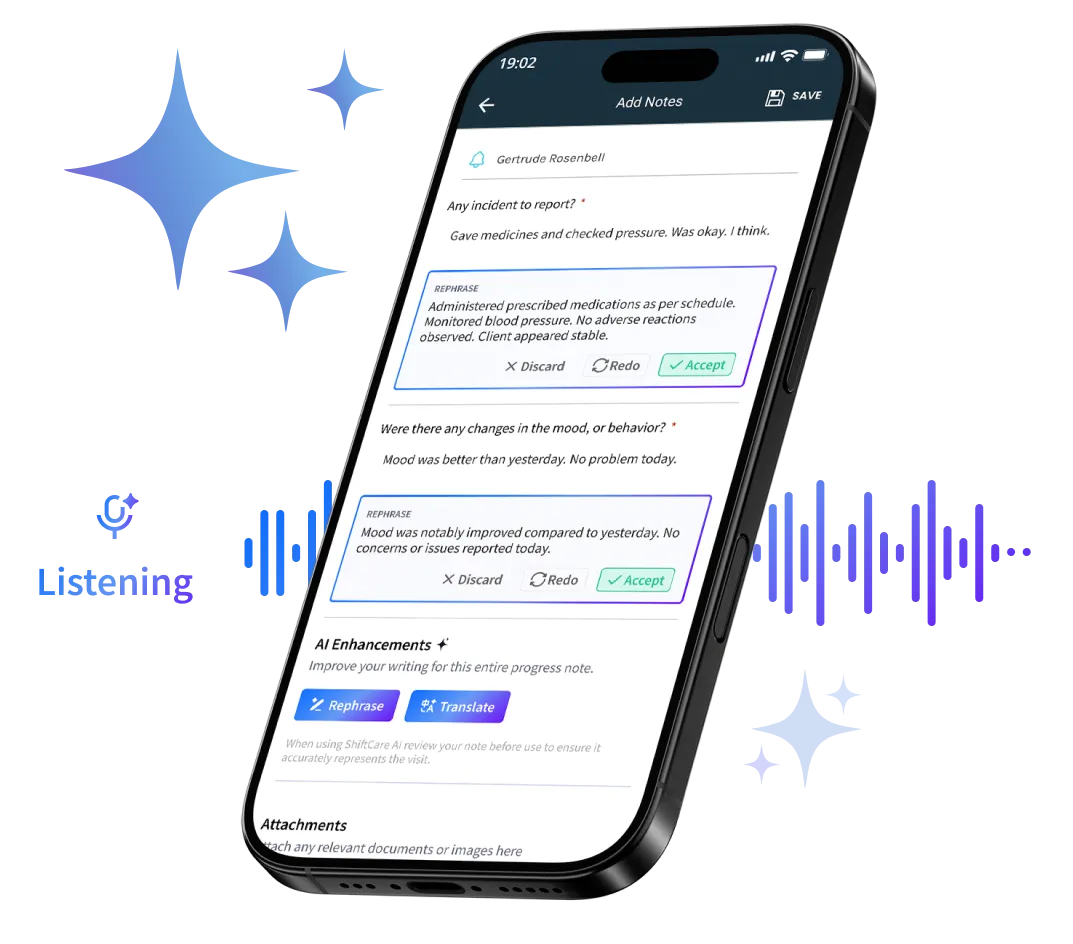
- Visit verification through the mobile app
- Automated alerts for cost leakage patterns
Ownership.
- Roster cost awareness during scheduling
- Smart staff matching to reduce overtime
- Cancellation redeployment workflows
- Branch-level operational dashboards
Sized for your operation.
The providers who win won't grow fastest. They'll leak the least. Whether you're a 20-person team or a 1,000-staff organisation, there's a path to operational discipline.
Under 50 staff?
Start your free trial today. See your numbers in the first week. No credit card required.
Start Free Trial50 to 1,000 staff?
Book a consultative margin review. We'll run your 5 numbers with you and show you where the leakage sits.
Book Margin Review →More ShiftCare features.

Rostering.
Build rosters with SCHADS award rules, smart staff matching, and real-time cost visibility before you confirm a single shift.
Explore features →
Invoicing.
Generate SAH-compliant claims, manage co-contributions, and invoice clients automatically from delivered services.
Explore features →
Support Worker App.
GPS clock-in/out, shift notes, visit verification, and real-time availability, all from your support workers' phones.
Explore features →Any questions?
What is operational leakage in aged care?
Operational leakage is the margin lost through everyday operational decisions: overtime patterns, casual dependency, late clock-outs, cancellation recovery failures, and billing gaps. For a 150-client provider operating at 10% margin, this typically totals $510,000 annually. It's not caused by poor care or bad intent; it's caused by micro-decisions made every shift that no one is measuring weekly.
How does Support at Home affect provider margins?
Support at Home eliminated package management fees (previously up to 15%) and capped care management at 10%. Providers who previously operated with up to 35% margin buffer outside service delivery now operate with roughly 10%. The new model uses per-service transaction billing, quarterly budgets with rollover caps, and price caps from July 2026. Margin must come from operational efficiency, not fee structures.
What are the 5 numbers every care provider should track?
Overtime percentage (target: below 5%), casual percentage (target: below 30%), paid vs billed ratio (target: above 95%), cancellation recovery rate (target: above 80% redeployed within 15 minutes), and leave exposure (target: below 6 weeks accrued). These five metrics give providers weekly visibility into margin health. If you're reviewing these monthly, you're always reacting. Managing them weekly means you're in control.
How does ShiftCare help with Support at Home compliance?
ShiftCare connects scheduling, verification, timesheets, claims, billing, and reporting in one system. Claims are generated from delivered services with the correct SAH service codes. Award rules fire before rosters are confirmed. Co-contributions, pricing rules, and activity statements are managed within the platform. This means fewer rejected claims, faster cash flow, and audit-ready records without spreadsheet workarounds.
What is the difference between NDIS and Support at Home margin pressure?
NDIS operates under fixed price caps with rising costs: SCHADS wages increase, penalty rates expand, and compliance loads grow, while the rate card rarely keeps pace. Support at Home restructured the entire fee model, removing package management, capping care management, and introducing per-service transaction billing. Both create the same outcome: margin lives in operational discipline, not in pricing or fee structures.
What is the Support at Home program?
Support at Home replaces the Home Care Packages Program and Short-Term Restorative Care as part of the New Aged Care Act. It introduces a unified funding model with eight funding levels, quarterly budgets, a new co-contribution framework, and defined services that clients are approved for. Providers must collect co-contribution amounts from clients, with price caps applying from July 2026. The program started on 1 November 2025.