$285,000 leaks out of the average NDIS provider every year. Find your number.
Three minutes. No email. No login. We'll show you exactly where your operation is bleeding margin across overtime, cancellations, billing and casual loadings, and what 7,000+ providers on ShiftCare do to close the gap.
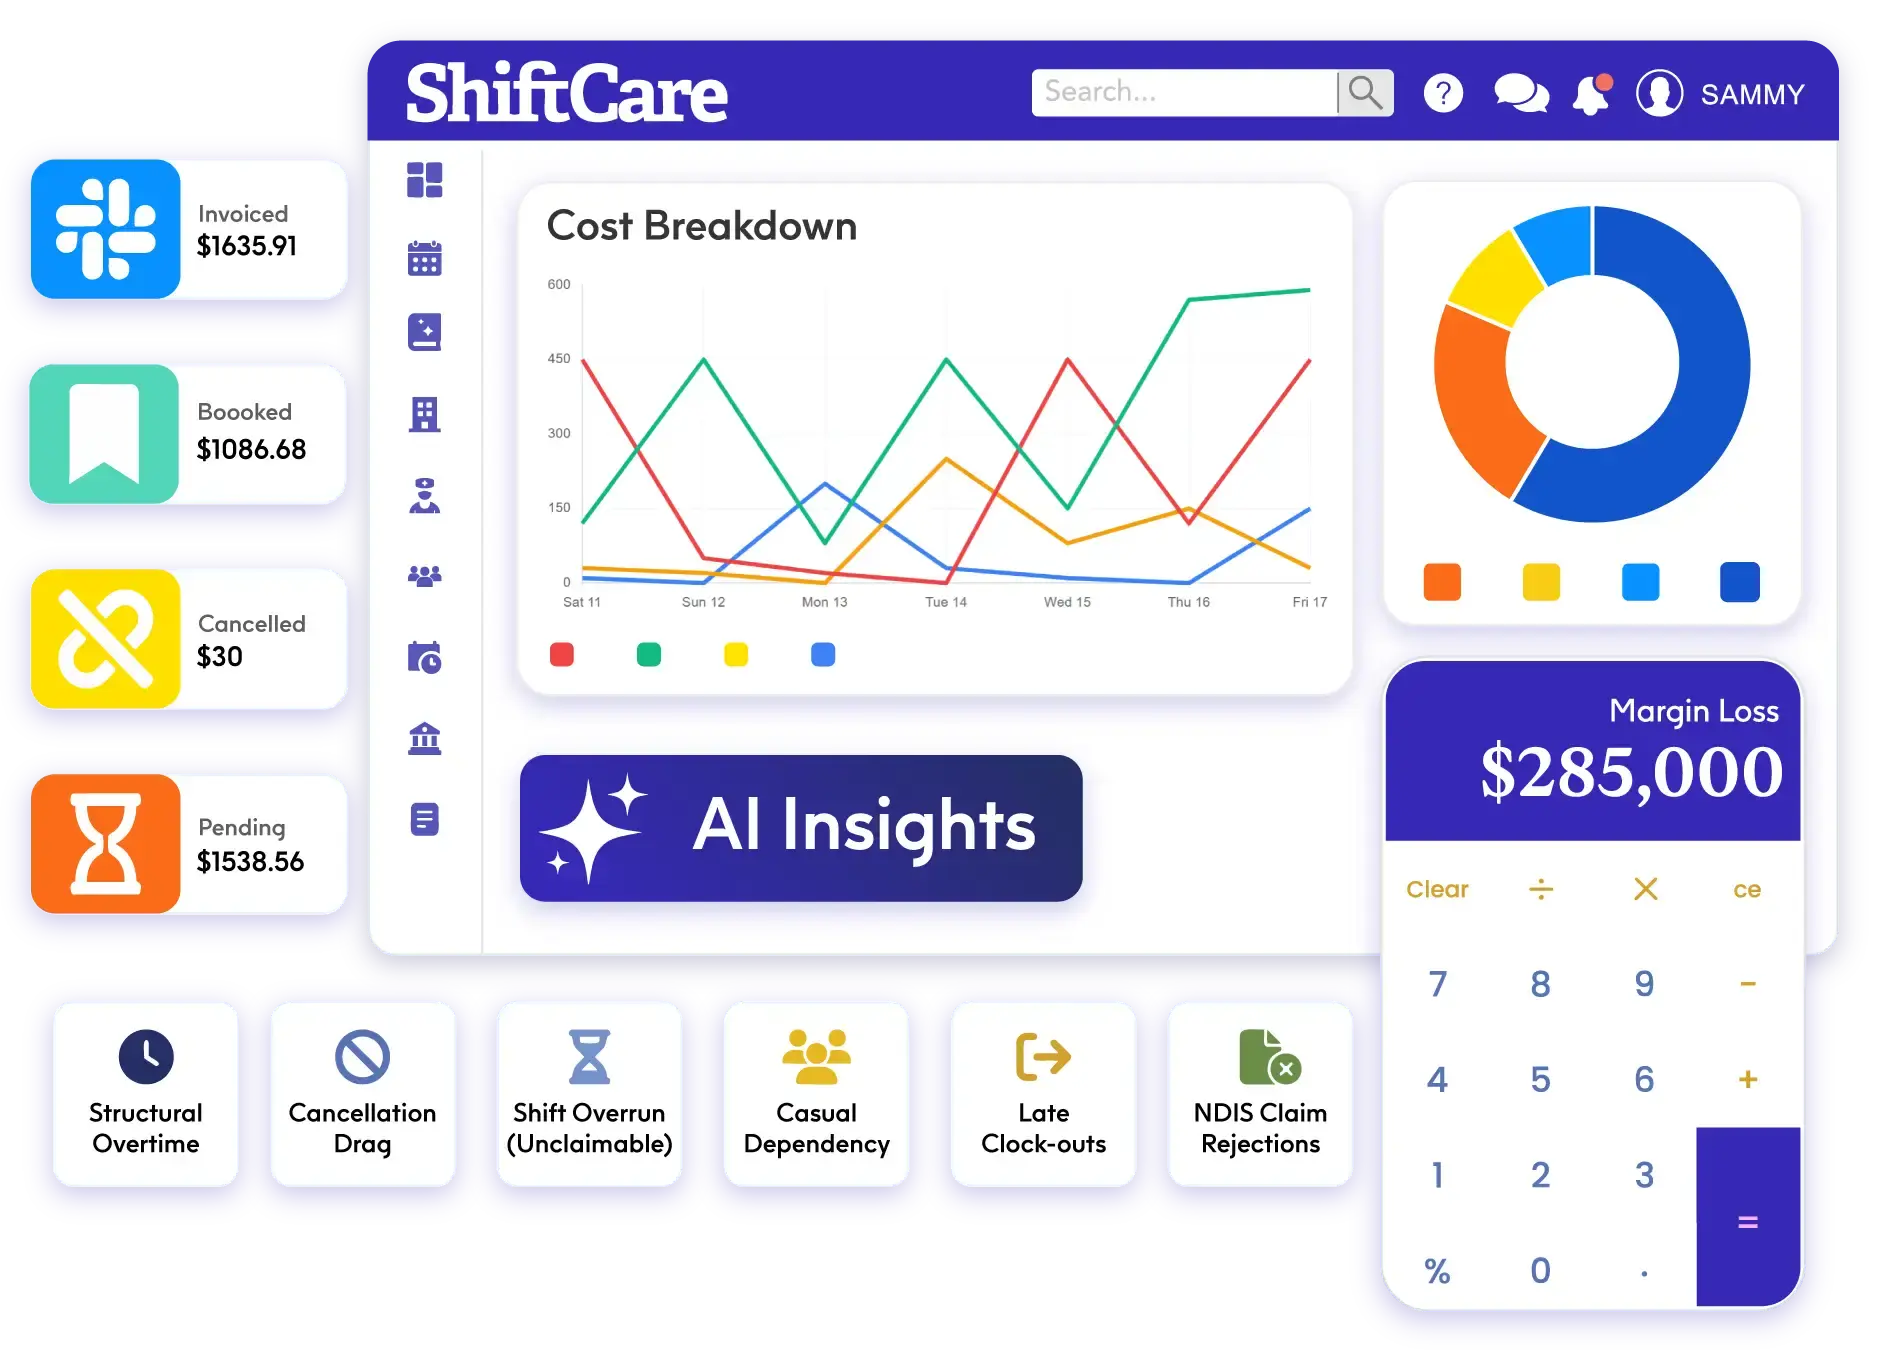
Six places your margin is leaking right now.
Defaults reflect SCHADS 2026 benchmarks for a 100-participant NDIS provider. Tune any input to match your business. We'll show your annual leakage as you go.
Tell us about your business
Optional: tune the assumptions to your business
Every card below uses 2026 SCHADS benchmarks by default. Click any card to see the math and adjust if your numbers are different. Or skip ahead — the defaults reflect what most providers experience.
Structural overtime
Triggered when rosters don't match demand patterns. You're paying time-and-a-half because the right person wasn't on the right shift.
Cancellation drag
One cancellation a day = 780 lost hours a year. If you can't backfill within the 7-day NDIS window, the revenue is gone but the wage cost stays.
Shift overrun & unbilled time
11% of shifts run late by an average of 24 minutes. Under NDIS price caps, overrun is not claimable — you absorb it.
Casual dependency
Excess casual hours carry a 25% SCHADS loading. Every casual hour that could have been a permanent worker is $8–$9 of margin gone.
Late clock-outs
Cultural pattern, 24 minutes past shift end on average. 63% of late clock-outs come from full-time staff. Compounds weekly until it's addressed.
NDIS claim rejections
Wrong line item, expired plan, exceeded budget. 4–6% rejection rate is typical. Every rejected claim that sits in a queue burns admin time AND cash flow.
Your operation is leaking margin every week.
in margin lost every year before you win a single new participant
A 30-minute working session with a ShiftCare ops specialist. We'll walk through your six lines, benchmark against 7,000+ providers, and identify the two changes that move the number fastest. No deck, no demo unless you ask.
Walk me through my $285,880 leakage →⏱ 30 mins · No deck · No pitch · Free
Where your margin is going.
What this means: at a 10% net margin, you'd need to win $2.86M in new revenue just to cover what's leaking. That's the equivalent of 2–3 fully ramped enterprise contracts.
Want proof before you book?
One ShiftCare customer saved $10,000 a month in overtime within 30 minutes of going live. Read how Sunflower Services did it — or share your number with your team first.
How we calculated this →
All defaults reflect SCHADS Award 2026 benchmarks for an NDIS provider. Numbers are sourced from ShiftCare's CEO keynote at ShiftCare Connect Melbourne (29 April 2026), based on aggregated platform data across 4.1 million shifts per month and 7,000+ provider customers.
- Overtime: hours per week × $17 blended SCHADS penalty × 52
- Cancellation drag: cancels per day × 260 working days × shift length × (1 - recovery rate) × $83 margin per hour
- Shift overrun: total shifts × overrun % × overrun minutes ÷ 60 × $38 hourly cost
- Casual dependency: excess casual hrs/wk × $8.65 SCHADS loading × 52
- Late clock-outs: total shifts × late % × late minutes ÷ 60 × $20 wage cost
- Claim rejections: total claims × rejection rate × never-recovered % × $140 average claim value
- Net margin assumption: 10% (per Matt Cagney, ShiftCare CEO: "we're now in a 10 cents in the dollar world")

It's been on for 30 minutes and it's already picking up some pretty wild stuff. Wow! This could be game changing for the org.
National Accommodation Manager
Sunflower Services, NDIS Provider NSW
$10,000 saved in 30 minutes. $1.2M in equivalent revenue.
Sunflower Services turned on ShiftCare's Hours Cap on day one. Within the first hour, their overtime exposure dropped by $10K/month — the equivalent of $1.2M in new revenue at a 10% margin, without winning a single new participant.
Hours Cap stops overtime before it happens
Daily, weekly, fortnightly and monthly caps per worker. Roster blocks the shift, not your payroll.
Care Signals surfaces incidents in real time
AI reads every shift note as it's written. 1 in 4 contains a risk signal nobody had time to read.
Daily PRODA claiming closes the cash flow gap
Auto-validated line items. Fewer rejections. Money in the door faster, every day.
Run your number, then walk it through with us.
30-minute working session. We'll benchmark your six lines against 7,000+ providers and identify the two changes that move the number fastest.
Book a 30-min margin review →
If you can't see these every Monday, the leakage already happened.
The leakage stack isn't a one-time fix. It's a weekly discipline. ShiftCare surfaces these five numbers every Monday morning, on every account, automatically.
Overtime < 5%
Above 8% means it's a structural rostering problem, not a staffing problem.
Casual mix < 30%
Above 40% and the SCHADS loading is eating margin every week.
Paid vs Billed > 95%
The gap is the time you funded out of your own pocket.
Cancellation recovery > 80%
Two cancels a day across a normal provider = 1,500 lost hours and $130K margin a year.
Leave exposure < 6 weeks
Higher and you're funding the leave gap with overtime or casuals — paying twice.
Any Questions?
How accurate are the default numbers?
Defaults are calibrated to a 100-participant NDIS provider operating under SCHADS 2026. They reproduce the $285K total Matt Cagney presented at ShiftCare Connect Melbourne in April 2026, sourced from aggregated platform data across 4.1 million shifts per month and 7,000+ providers. Every input is adjustable — if your numbers are different, change them and the result updates live.
Will my data be saved or shared?
No. Everything you enter stays in your browser. The calculation runs locally, the result is yours, and we don't store or send your inputs anywhere unless you choose to book a margin review with us. No email required to see your number.
I'm a Support at Home provider, not NDIS. Is this still relevant?
Yes. Five of the six leakage lines apply identically to SaH providers — overtime, cancellations, shift overrun, casual dependency and late clock-outs all behave the same way under the new SaH funding model. The sixth line swaps NDIS claim rejections for unbilled travel, which is the bigger margin issue under SaH price caps. Switch the provider type to "Aged care & Support at Home" at the top of the calculator and the math adjusts automatically.
Why 10% as the margin assumption?
Under the NDIS Reset and Support at Home reforms, the funding model now embeds 90% of the dollar in service delivery, leaving roughly 10% for everything else. Last year, 55% of providers actually lost money. The 10% figure is the realistic ceiling, not the average. If your business runs higher, change it in the methodology panel and the revenue-replacement number adjusts.
What happens on a margin review call?
It's a 30-minute working session, not a sales pitch. A ShiftCare ops specialist walks through your calculator result with you, benchmarks each of your six lines against the 7,000+ providers on the platform, and identifies the two changes that will move your number the fastest in the next 90 days. No deck, no demo unless you ask. Free.
I already use a rostering tool. Is this still useful?
Most of the six leakage lines aren't visible inside a rostering tool — they show up in payroll, in claims, in cancellation reports, and in cultural patterns like late clock-outs. The calculator surfaces what your current stack isn't showing you. If you'd like to see how a unified care operating system surfaces all six in one place every Monday morning, that's exactly what the margin review walks through.
Run your number. Then close the gap.
Margins went from 35 cents in the dollar to 10. The providers who are growing aren't winning more participants. They're closing the leakage stack.