NDIS and aged care provider margins have compressed from 35% to 10% in the last five years. The structural sources of profitability are gone. Under Support at Home, 90% of the budget goes directly to service delivery hours. Package management fees that providers could charge up to 15% under Home Care Packages have been eliminated. The funding model no longer builds margin into the structure. Providers now protect margin through operational efficiency: how well they schedule, how effectively they utilize workers, how efficiently they route travel, and how accurately they bill.
55% of aged care providers lost money last year, and 21% of providers have already left. To maintain your profit margins, you need to understand that aged care requires a more streamlined, compliant approach to daily operations. Here’s what you should know:
What Happened to Provider Margins in 2026

Aged care providers were built for 35 cents in the dollar. The funding model included package management fees (up to 15% of package value), supplements for dementia care and veterans, and flexibility to charge extras for additional services. Providers could generate margin without perfect operational efficiency because the structure paid for overhead and profit.
Support at Home eliminated this. The new funding model allocates 90% of budgets to direct service delivery. Package management fees are gone. Administrative loading is capped. The funding structure no longer subsidizes operational inefficiency or provides built-in margin.
GEN Aged Care Data reports 55% of residential aged care providers operated at a loss in the 2024-25 financial year. Home care providers face the same compression under Support at Home. Margin is now entirely dependent on operational execution.
Why Package Management Fees Don’t Exist Anymore

Home Care Packages allowed providers to charge package management fees up to 15% of the total package value. A Level 4 package worth $52,000 annually could generate $7,800 in management fees before delivering a single hour of care. These fees covered administration, care coordination, case management, and profit.
Support at Home removed package management fees from the funding model. The new structure pays for service hours, not administration. Providers bill for care delivery at published hourly rates. There is no separate stream for coordination or management overhead. The 90% service delivery allocation means administrative costs must come out of the 10% remaining, not from a dedicated fee structure.
This structural change means providers cannot rely on management fees to cover fixed costs. Profit comes from delivering service hours efficiently, not from managing packages.
The Four Operational Levers Left for Margin Protection
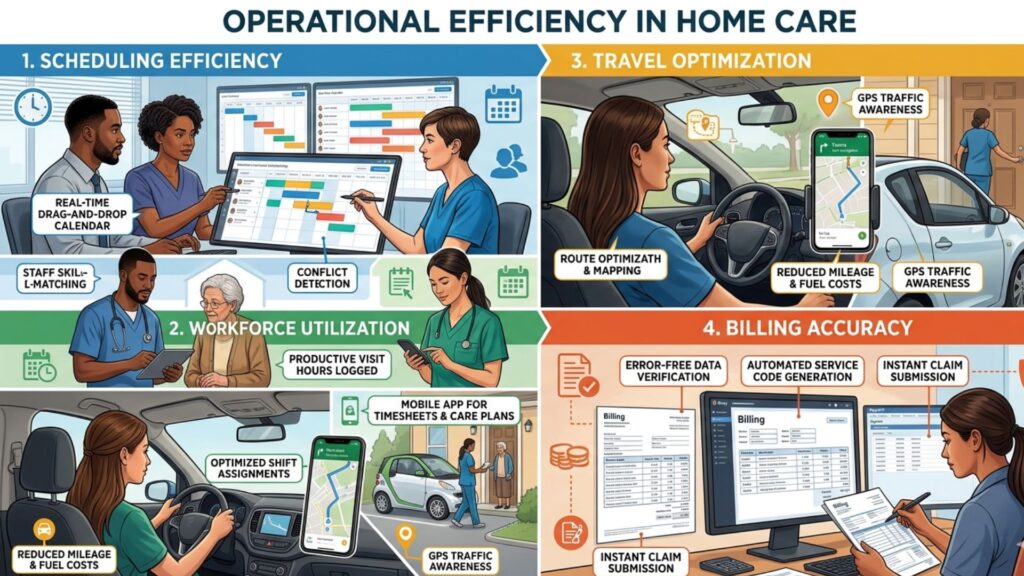
Four levers determine whether providers operate profitably under the new funding model: scheduling efficiency, workforce utilization, travel optimization, and billing accuracy. These are operational, not structural. Margin depends on how well providers execute each lever daily.
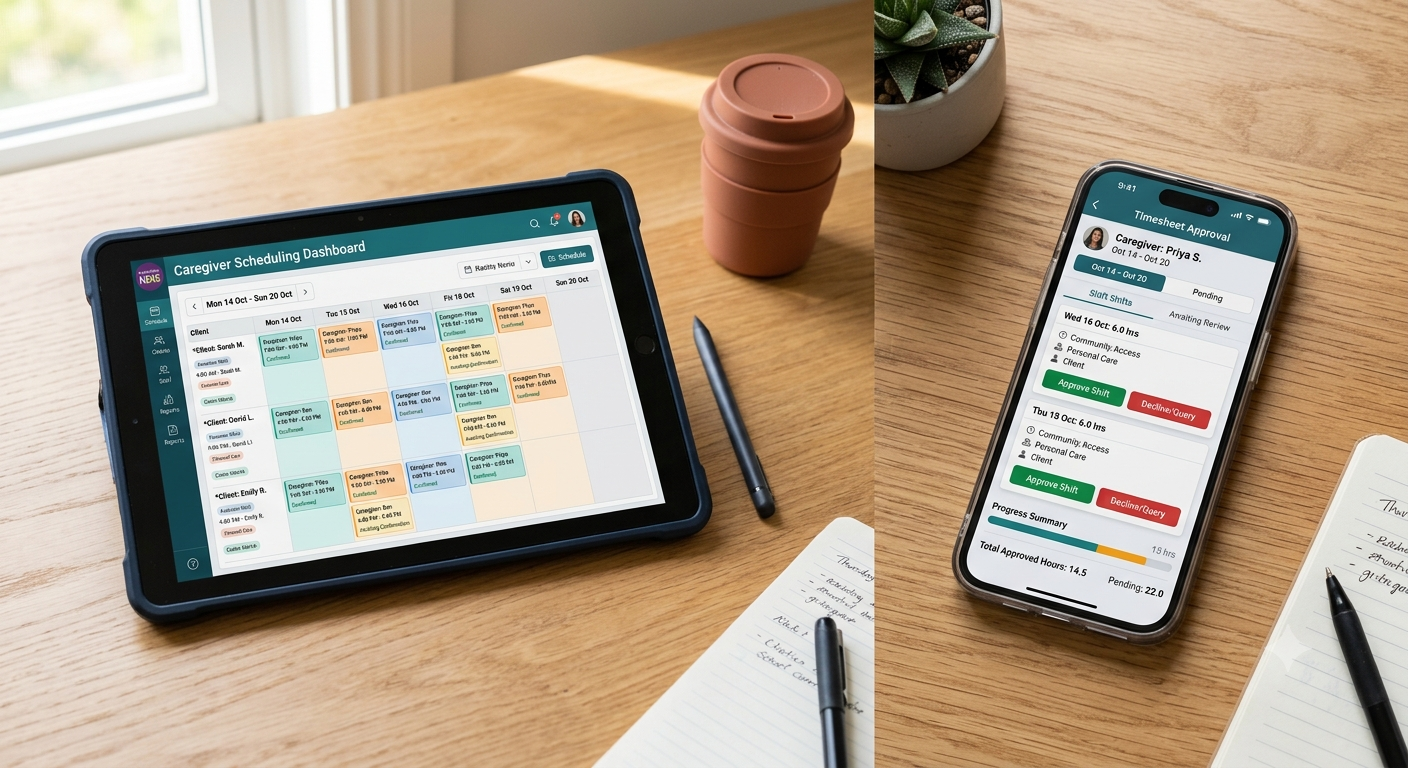
- Scheduling efficiency: Matching worker availability to participant demand, minimizing unfilled shifts, reducing overtime premiums.
- Workforce utilization: Maximizing billable hours per worker, reducing gaps between shifts, eliminating unproductive rostered time.
- Travel optimization: Clustering clients geographically, minimizing non-billable travel time, reducing vehicle and fuel costs.
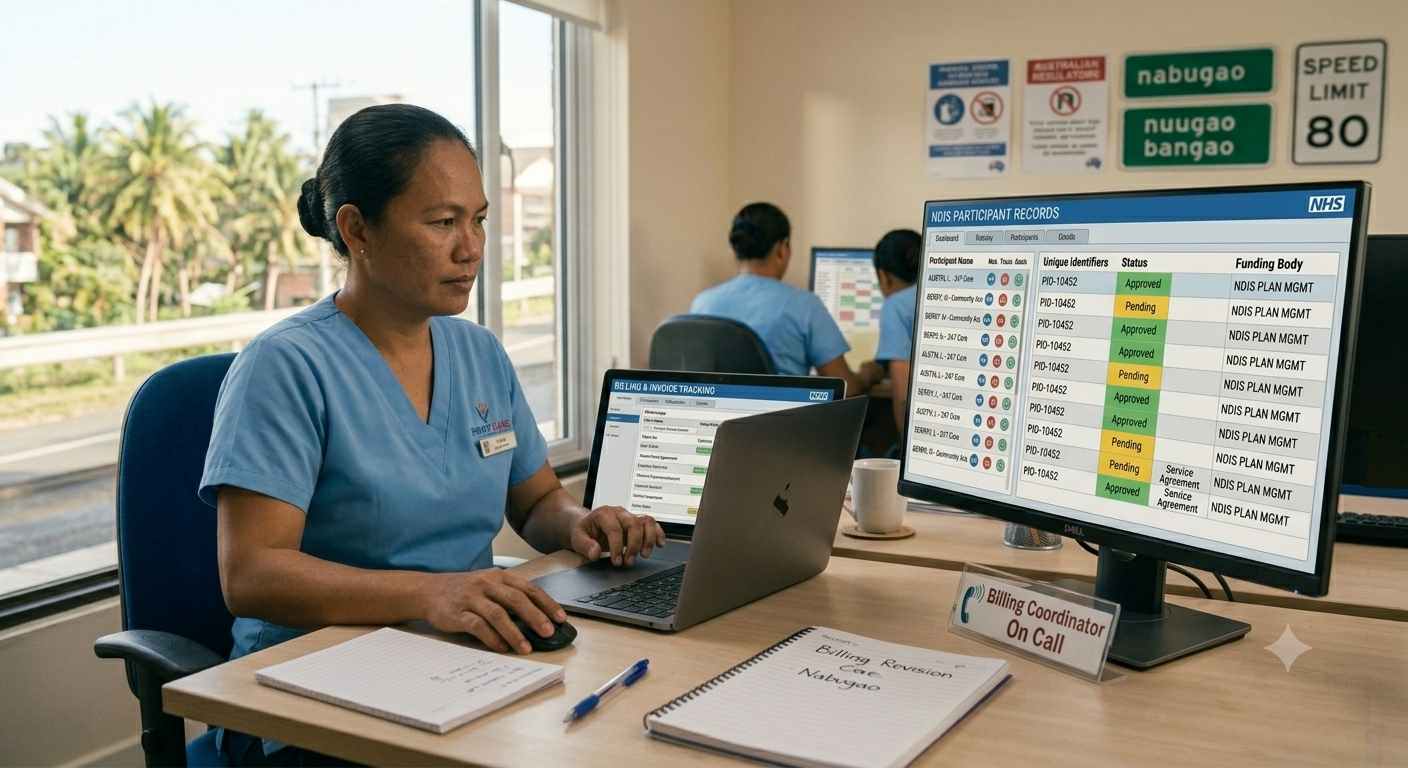
- Billing accuracy: Preventing NDIS Price Guide errors, avoiding claim rejections, ensuring correct rate codes and service agreements.
Providers operating at 10% margins cannot absorb inefficiency in any of these areas. A 2% improvement across all four levers can mean the difference between profit and loss.
Scheduling Efficiency: What 1% Improvement Means
A 100-participant NDIS provider typically rosters 50 to 60 support workers delivering 4,000 to 5,000 billable hours monthly. SCHADS Award Level 2 workers cost approximately $30 per hour fully loaded (base wage plus superannuation, leave loading, workers compensation). Annual labour costs run $1.4M to $1.8M.
Scheduling inefficiency shows up as overtime premiums (time-and-a-half or double-time rates), unfilled shifts requiring emergency casual callouts at higher rates, or workers rostered for shifts that get cancelled. A 1% improvement in scheduling efficiency saves $14,000 to $18,000 annually for this provider.
Efficiency improvements include: filling shifts with permanent staff instead of casuals (avoiding 25% casual loading), matching worker availability to participant preferences (reducing cancellations), and preventing rostered hours from pushing workers into overtime thresholds.
The SCHADS Award sets overtime at time-and-a-half after 38 ordinary hours per week. A worker rostered for 40 hours costs 2.5 hours at penalty rates instead of 2 hours at ordinary rates. Preventing this across 50 workers generates measurable savings.
Workforce Utilization: Reducing Unproductive Hours
Workforce utilization measures billable hours as a percentage of total rostered hours. A support worker rostered for 38 hours who delivers 30 billable hours operates at 79% utilization. The 8-hour gap represents wages paid for travel time, administrative tasks, training, or unproductive gaps between shifts.
Providers with 70% utilization rates lose 30% of rostered labour costs to non-billable activities. Improving utilization to 75% recovers 5% of labour costs as billable revenue. For a provider spending $1.5M annually on labour, that’s $75,000 in additional billable hours.
Utilization improves through: geographic clustering of participants (reducing travel time between shifts), back-to-back shift scheduling (eliminating gaps), and accurate demand forecasting (avoiding overstaffing during low-demand periods).
NDIS Price Guide rates assume reasonable travel time between participants. Providers cannot bill for excessive travel caused by poor route planning or scattered client locations. Utilization rates directly reflect how well providers match rostered hours to billable service delivery.
Travel Optimization: Cutting Non-Billable Costs

NDIS Price Guide includes travel allowances: $0.99 per kilometer for provider transport or $15.39 to $20.52 per hour for public transport accompaniment. These rates cover travel costs but do not generate margin. Non-billable travel time is pure cost.
A support worker travelling 30 minutes between clients spends 1 hour daily (2 × 30-minute trips) on non-billable travel. Across 50 workers, that’s 50 hours daily or 1,000 hours monthly of paid but unbillable time. At $30 per hour, that’s $30,000 monthly in travel costs.
Reducing average travel time by 10 minutes per worker per day saves 17 hours daily (50 workers × 20 minutes ÷ 60), or 340 hours monthly. That’s $10,200 monthly, $122,400 annually, recovered from travel inefficiency.
Travel optimization requires: assigning workers to participants within a defined geographic radius, scheduling consecutive visits in the same area, and using route planning tools to minimize driving time. Providers operating across large geographic areas face higher travel costs and lower utilization rates than those with geographically concentrated client bases.
Billing Accuracy: Preventing Revenue Loss from Errors
NDIS providers submit claims through the NDIS portal using service booking numbers tied to participant plans and Price Guide line items. Claims get rejected for: incorrect Price Guide item numbers, service delivered outside approved plan dates, missing service agreements, wrong provider registration group, or incorrect rate loadings (remote/very remote).
Rejected claims delay payment by 2-4 weeks while providers identify errors, correct submissions, and resubmit. Providers operating on thin cash flow cannot absorb 2-week payment delays across 10-15% of monthly claims.
Billing accuracy requires: real-time Price Guide validation during shift creation, automated matching of services to participant plan line items, and verification that service agreements cover the scheduled service type and dates. Providers using manual billing processes or disconnected systems typically see 5-10% claim rejection rates. Integrated systems with automated validation reduce this to under 2%.
A provider billing $200,000 monthly with a 10% rejection rate loses $20,000 in delayed revenue monthly. Reducing rejections to 2% recovers $16,000 monthly in cash flow timing. The administrative cost of fixing and resubmitting rejected claims adds another layer of operational expense.
Operating Systems Protect Margins, Rostering Tools Don’t
Rostering tools schedule shifts. Operating systems optimize all four levers simultaneously: scheduling efficiency, workforce utilization, travel optimization, and billing accuracy. Providers operating at 10% margins need systems that prevent inefficiency before it reaches payroll, not tools that only manage shift assignments.
ShiftCare tracks real-time budget utilization, validates NDIS Price Guide rates during shift creation, clusters participants geographically for route optimization, and flags SCHADS Award breaches before rosters finalize. These aren’t rostering features. They’re margin protection functions built into an operating system designed for the 10% margin environment.
Start your free trial today. See how ShiftCare helps NDIS and aged care providers protect margins through scheduling efficiency, workforce utilization, travel optimization, and billing accuracy.